Interest on the National Debt: Why $20 Trillion Is Coming Due by 2036
Zach Hill · November 18, 2026
Last updated: November 18, 2026
Disclaimer: This content is for informational purposes only and does not constitute financial advice. Budget projections are estimates based on current law and change as policy, interest rates, and the economy change.
Every second, the $40+ trillion national debt ticks higher, and every year the government pays a bigger bill just to carry it. This fall, the Congressional Budget Office (CBO) put a number on how big that bill gets: roughly $20 trillion in interest between 2026 and 2036, rising from $1.2 trillion in 2026 to nearly $2.5 trillion a year by 2036. That works out to about $200 billion a month (Fortune).
So is $20 trillion the right number? The honest answer is: it depends on which CBO measure you use, but under either one, interest is the fastest-growing part of the federal budget. Let's look at the numbers.
Key Takeaways
- $20.1 trillion is the 10-year interest total in CBO's October 2026 national income and product accounts (NIPA) projections
- $16.2 trillion is the same decade's net interest in CBO's standard budget baseline, so you will see both figures quoted
- Interest hits a record share of the economy at 3.3% of GDP in 2026, above the 1991 peak of 3.2%, and climbs to 4.6% by 2036
- Interest is the fastest-growing major budget category, up 106% from 2026 to 2036 versus 85% for Medicare and 65% for Social Security
- Interest passes Medicare by 2029 and Social Security by 2048, becoming the largest single federal expense
- By 2036, interest nearly equals all discretionary spending at $2.1 trillion versus $2.2 trillion
- The revenue squeeze is real: interest takes about 18% of federal revenue in 2026 and about 25% in 2036 (our calculation from CBO's figures)
$20 Trillion or $16 Trillion? Why There Are Two Numbers
Both figures come from CBO, and both start from the agency's February 2026 baseline. The $20.1 trillion comes from CBO's October 2026 translation of that baseline into the national income and product accounts, the framework CBO uses for its economic forecast. The $16.2 trillion is net interest in the standard federal budget presentation.
| Measure | 2026 | 2036 | 10-Year Total |
|---|---|---|---|
| NIPA interest (October 2026) | $1.2T | ~$2.5T | $20.1T |
| Budget net interest (February 2026) | $1.0T | $2.1T | $16.2T |
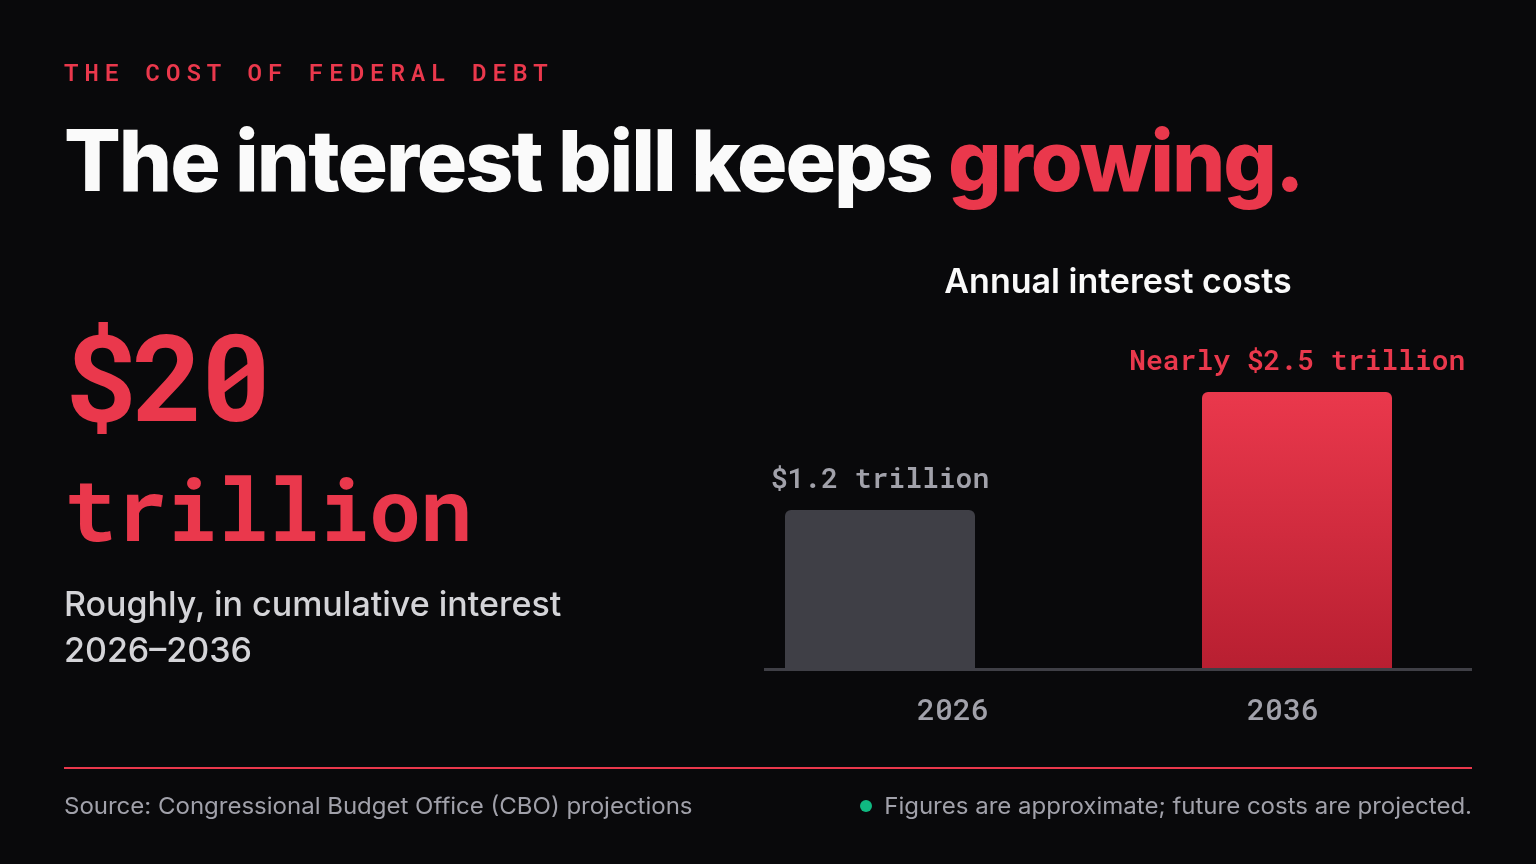
The gap reflects different accounting conventions, not a different view of the debt. We use the budget measure for rankings and share-of-GDP comparisons below, because that is the basis CBO publishes them on. Either way, the direction is the same: up, and fast.
Source: CBO NIPA projections, Fortune, House Budget Committee summary of CBO's February 2026 baseline
The Interest Time Bomb: Record After Record
Interest costs are already at a postwar high, measured against the size of the economy. The government will spend 3.3% of GDP on interest in 2026, topping the 3.2% peak set in 1991. By 2036, CBO has it at 4.6%, more than double the 50-year average of 2.1%.
| Milestone | When | What Happens |
|---|---|---|
| New postwar record | 2026 | Interest reaches 3.3% of GDP, above the 1991 high of 3.2% |
| Interest passes Medicare | By 2029 | Only Social Security is larger |
| Interest reaches 4.6% of GDP | 2036 | More than twice the 50-year average |
| Interest passes Social Security | By 2048 | Largest single federal expense |
Over 2026 to 2036, interest grows 106%, faster than Medicare (85%) or Social Security (65%) (AAF analysis of CBO). The 2029 Medicare crossover is from Fortune's reporting on CBO's baseline, and the 2048 Social Security crossover is from CBO's long-term outlook. Unlike defense or education, interest buys no service and builds nothing. It only carries past borrowing.
Track interest costs in real time on our debt clock.
Where the Money Goes: 2026 vs. 2036
Interest is the one line in the budget that grows by more than 100% in a decade. Here is how CBO's February 2026 baseline compares the major pieces:
| Category | 2026 | 2036 | Growth |
|---|---|---|---|
| Net interest | $1.0T | $2.1T | +106% |
| Discretionary spending | $1.9T | $2.2T | ~+16% |
| Mandatory spending (excluding interest) | $4.5T | $7.0T | ~+56% |
| Total spending | $7.4T | $11.4T | ~+54% |
| Revenue | $5.6T | $8.3T | ~+48% |
Source: House Budget Committee summary of CBO's February 2026 baseline. Growth rates other than interest are our arithmetic from CBO's figures.
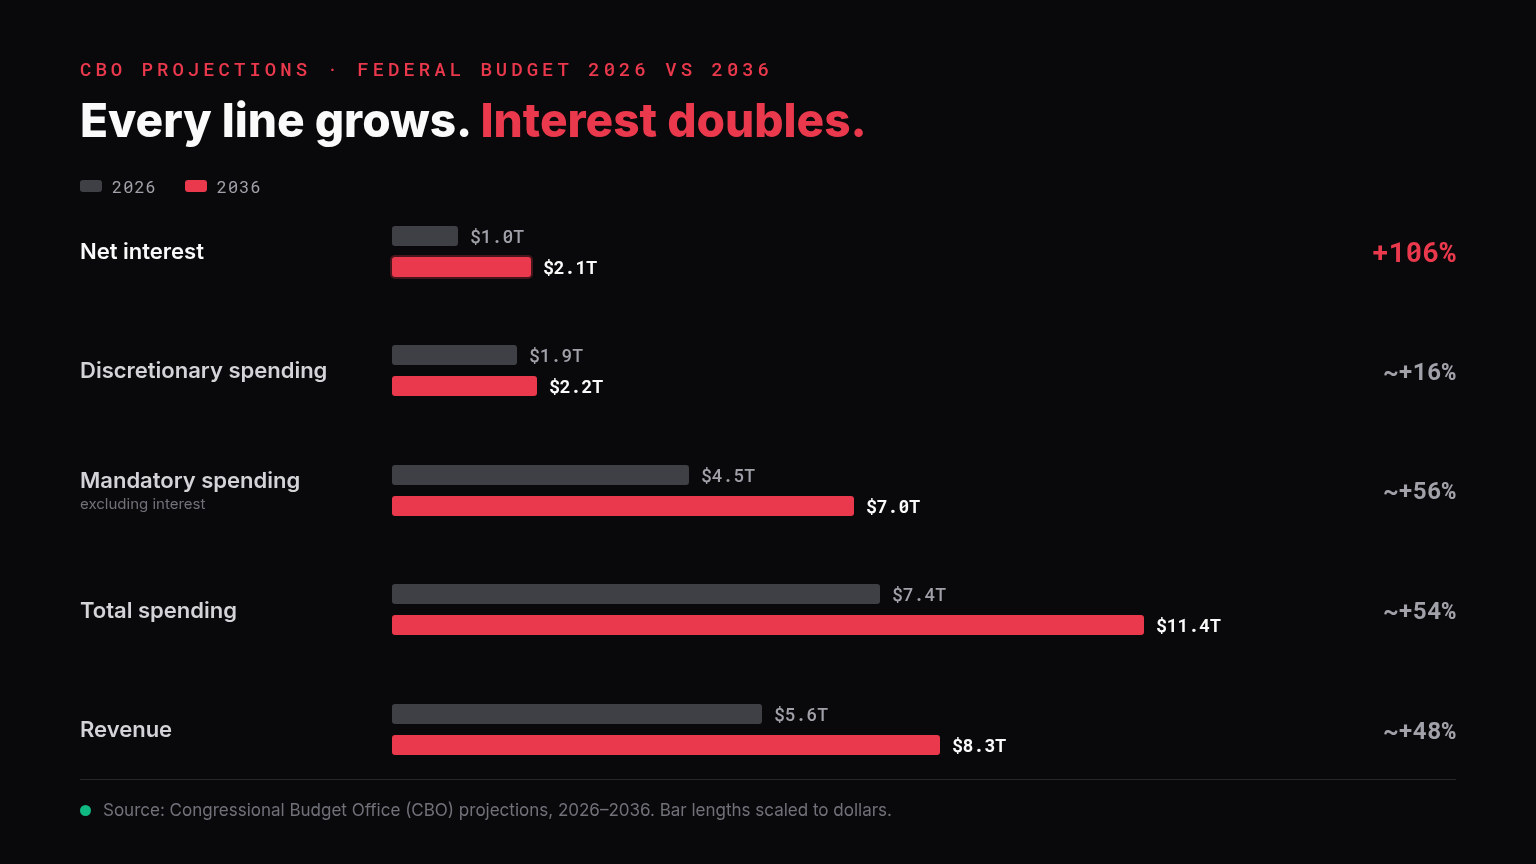
Discretionary spending is the money Congress appropriates each year for defense, agencies, and grants. In 2026, interest is about half that size. By 2036, it is nearly the same size, so every dollar of future interest is a dollar that competes with the things Congress actually votes on.
Interest also takes a growing slice of what the government collects. Using CBO's numbers, interest is about 18% of the $5.6 trillion in revenue in 2026 and about 25% of the $8.3 trillion projected for 2036. Put another way, one in every four tax dollars would go to interest rather than to services.
Why the Bill Keeps Growing
Interest grows because the debt grows, and the debt grows partly because of interest. CBO's baseline has gross federal debt rising from $38.6 trillion to $63.7 trillion by 2036, or 136.4% of GDP. Annual deficits widen from $1.9 trillion to $3.1 trillion, and the cumulative deficit over the decade is $26.3 trillion (CBO, House Budget Committee).
That creates a loop: higher interest adds to the deficit, a bigger deficit means more borrowing, and more borrowing means more interest. See how the pieces fit on our debt-to-GDP ratio explainer and the national debt by year timeline.
What Could Change the Number
These are projections under current law, so the totals move with three things.
Interest Rates
Interest costs track the average rate the Treasury pays on its debt. A different rate path shifts the total in either direction, and with a debt this large, small changes in rates add up to hundreds of billions of dollars.
Tariffs
CBO assumes tariff rates as of November 2025 stay in place permanently, and counts about $3 trillion of deficit reduction from them over ten years (Cato). If tariffs change, the borrowing path, and the interest on it, changes too.
Whether Current Policies Are Extended
Analysts at the Tax Policy Center and Brookings note that current-law projections can understate the debt if expiring policies are extended (Gale and Auerbach). A higher debt means a higher interest bill.
How to respond, through spending cuts, higher revenue, faster growth, or some mix, is a political debate. The arithmetic is not: the longer the debt grows, the more of each year's budget goes to interest. These aren't partisan issues. They're mathematical realities that any administration will have to confront.
What This Means for You
You can't control federal interest costs, but you can prepare for a world where they stay high:
- Pay down high-interest debt first. Credit card debt at 20%+ APR is expensive in any rate environment
- Watch borrowing costs. Heavy federal borrowing can put upward pressure on rates for mortgages and other loans
- Know your share. Use our debt calculator to see what the national debt works out to per citizen and per taxpayer
- Stay informed. Follow the numbers on our live debt tracker
This is general information, not personalized financial advice. Consult a qualified financial advisor about your own situation.
Looking Forward
Whichever measure you use, interest will cost between $16 trillion and $20 trillion over the next decade, and it will outgrow Medicare, Social Security, and every other major budget category. The $200 billion a month is the headline. The lasting point is that a rising share of every tax dollar goes to the past rather than to anything new.
Frequently Asked Questions
1. How much will the US pay in interest on the national debt over the next 10 years?
CBO's budget baseline puts net interest at $16.2 trillion from 2026 to 2036. Its NIPA translation, published in October 2026, puts interest at $20.1 trillion over the same period. Both start from the same February 2026 baseline and differ in accounting conventions.
2. How much does the US pay in interest per month?
On the budget measure, about $85 billion a month in 2026 ($1.0 trillion a year), rising to about $175 billion a month by 2036 ($2.1 trillion a year). On the NIPA measure, the 2036 figure is about $200 billion a month.
3. Is interest the biggest part of the federal budget?
Not yet. Social Security and Medicare are larger today. CBO projects interest will pass Medicare by 2029 and Social Security by 2048, making it the single largest federal expense.
4. Why are there two different numbers for the same thing?
Because CBO reports interest under two accounting frameworks. The standard budget presentation counts net interest one way, while the national income and product accounts, used for the economic forecast, count it another. Neither is wrong, so always check which one a headline is using.
5. Do these projections assume any policy changes?
No. They assume current law. CBO also assumes tariff rates as of November 2025 stay in place, so changes to tariffs, tax policy, or spending would change the totals.
Related Resources
- US Debt Clock — Real-time national debt tracker
- Live Debt Tracker — Watch the debt grow in real time
- Debt-to-GDP Ratio Explained — Why this ratio matters
- US Debt by Year — Historical debt trajectory
- Government Spending Breakdown — Where $7 trillion in taxes goes
- Understanding the National Debt — Complete guide
- How Debt Affects Your Wallet — Mortgage rates and inflation
- Debt Calculator — Calculate your share of the national debt
Data sources: Congressional Budget Office, Fortune, House Budget Committee, American Action Forum, Cato Institute, Brookings/Tax Policy Center. Updated November 2026.